Tuesday, September 27, 2011
“फेरि दसैं आयो”
.
Happy Dashain to all.
“फेरि दसैं
आयो”
सारा खुशि र उमङ्ग एकैसाथ ल्यायो
समयको यस क्षणलाई स्वर्णिम तुल्यायो
साना ठूला सबैको ओठमा मुस्कान छायो
लामो समयको अन्तरालपछि फेरि दसैं आयो
के राजा? के रइती? सबै खुशि भए
दु:ख, कष्ट, पिर, व्यथा- सबै भागि गए
कर्मचारिले पनि आफ्नो पेश्की पायो
लामो समयको अन्तरालपछि फेरि दसैं आयो
के लाउने? के खाने? चिन्ता सब हरायो
दु:ख कष्ट बिर्साउने रमाइलो चाड आयो
बाटामा रङ्गिचङ्गी लुगा लाउनेको जमात छायो
लामो समयको अन्तरालपछि फेरि दसैं आयो
मनमा पलाएका स्वप्न सारा साकार हुने भए
कालरात्रीका क्षण, सारा अन्धकार हटीगए
बिहानिको मिर्मिरेसङ्गै उषाको नयाँ प्रभात उदायो
लामो समयको अन्तरालपछि फेरि दसैं आयो
नौलो देख्दछु म आज किन हो दिन यो?
क्षितिजसम्म दसैंको रङ्ग जमेको देखियो
कविको कविता बन्ने आज ममा रहर छायो
लामो समयको अन्तरालपछि फेरि दसैं आयो
Labels: poem
Nepal's population is 26,620,809
.
Central Bureau of Statistics has released some statistics from the 2011 national census.
Total Population: 26,620,809
Total male population: 12,927,431
Total female population: 13,693,378
Absentee population: 1,917,903 total number of Nepalis outside Nepal (was 762,000 in 2001)
Sex ratio: 94.41 males for 100 females (was 99.8 in 2001)
Annual population growth rate: 1.4 percent (was 2.25 percent in 2001 census)
Highest growing district: Kathmandu with 60.93 percent growth since 2001
Lowest growing district: Manang with 31.92 percent reduction since 2001
Population living in the Terai (plains): 50.15 percent
Population living in the Hills: 43.1 percent
Population living in the Mountains: 6.75 percent
Population living in urban areas: 17 percent (4.5 million people)
Population living in rural areas: 83 percent
Population density: 181 per square kilometer
Least dense district: Manang (3 per square kilometer)
Most dense district: Kathmandu (4408 per square kilometer)
Development region with largest population: Central region with 36.5 percent
Development region with smallest population: Far-western region with 9.6 percent
Average size of a household: 4.7 (was 5.44 in 2001)
District with largest HH size: Rautahat with 6.33
District with smallest HH size: Kathmandu with 3.71
MOST POPULATED DISTRICTS
Kathmandu: 1,740,977
Morang: 964,709
Rupandehi: 886,706
Jhapa: 810,636
Kailali: 770,279
LEAST POPULATED DISTRICTS
Manang: 6,527
Mustang: 13,799
Dolpa: 36,701
Rasuwa: 43,798
Humla: 51,008
Wednesday, September 21, 2011
Links for September 21, 2011
.
Union leads to closure of Fire and Ice restaurant
Asian Development Bank projects four per cent growth in 2012 for Nepal Nepal slips eight positions down in the Economic Freedom rankings
Union leads to closure of Fire and Ice restaurant
Asian Development Bank projects four per cent growth in 2012 for Nepal Nepal slips eight positions down in the Economic Freedom rankings
Nepal has slipped eight position down to be ranked at 129th among the 141 economies with a score of 5.50 in this year’s Economic Freedom of the World report released here today. Last year, Nepal was at 121st rank with a score of 5.54.World Development Report 2012: Gender Equality and Development shows that closing gender gap boosts growth
“Countries that create better opportunities and conditions for women and girls can raise productivity, improve outcomes for children, make institutions more representative, and advance development prospects for all,” it said, adding that in Nepal as many as 14 per cent married women are largely silent on how their earned money is spent. “But they are more actively involved in the decision making recently,” according the World Bank that revealed that women’s greater public voice not only benefits women and children but also men. “Giving women bigger say in managing forests in Nepal has significantly improved conservation outcomes too,” it added. “The disparities between boys and girls in primary education have almost closed over the past 25 years, and at the secondary level, the gaps are shrinking rapidly,” it said, lauding Nepal’s efforts in closing the gender gap.National Information Technology Centre to be established in Hetauda
The Centre’s building will be constricted at the estimated cost of Rs. 300 million with the grant assistance of the Korean governmentIndia set to overtake Japan as world's third largest economy
India is now the fourth-largest economy behind the US, China and Japan. Last year, Japanese economy was worth $4.31 trillion, while India´s was at $4.06 trillion. But after the devastating tsunami and earthquakes in March, Japan´s economy is expected to contract while India´s economy will grow between 7-8 percent this fiscal year.
Earlier, a report by PwC suggested that the Indian economy would surpass the Japanese economy in 2012. The IMF expects the Japanese economy to contract 0.7 percent this year while India is expected to grow 8.2 percent.BFIs told to insure deposits up to Rs 500,000
Banks and financial institutions (BFIs) that were required to compulsorily insure deposits up to Rs 200,000 will now need to insure all deposits up to half a million rupees.
Labels: banks, central bank of nepal, china, gender inequality, India, IT, Japan, labor unions
Monday, September 19, 2011
Reform Education: The great schools revolution
.
The Economist has an interesting article on education reform.


The Economist has an interesting article on education reform.
In 2000 the Programme for International Student Assessment (PISA) at the OECD, a rich-country club, began tracking academic attainment by the age of 15 in 32 countries.
Labels: education, OECD, reform
Sunday, September 18, 2011
Poverty Reduction and Inclusive Growth
.
The following opinion piece was published in Republica on September 18, 2011. The direct Republica link is here.
In 2010, a report for UNDP prepared by Oxford University caused a furor in Nepal when it mentioned that 65 percent of us lived under poverty. The report made its calculations by observing factors like nutrition, electricity, food, energy, drinking water and sanitation, maternal mortality, student enrollment, livelihood and availability of property. The study defined an MPI index—Multi-dimensional Poverty Index—as a measurement of poverty.
The MPI had two parts: Incidence of Poverty and Average Intensity of Deprivation. Incidence of poverty recorded the proportion of the Nepali population that was multi-dimensionally poor. The average intensity of deprivation recorded the average proportion of the indicators in which the population was deprived. The study claimed that 64.7 percent of Nepali households were poor, and 54 percent deprived.
Needless to say, the National Planning Commission (NPC) countered the findings of that report, and suggested that the national poverty was only 25.4 percent. The basic difference between the two numbers arises out of the mechanics of measurement. The Oxford measurement was clearly influenced by Prof Amartya Sen’s ideas of measuring poverty levels by observing overall human development and access to facilities. On the other hand, NPC’s measurement is pretty straightforward in specifying a poor person as being somebody who consumes less than 2144 calories per day. The NPC should have bothered to learn this difference before countering the findings.
However, despite the mechanics involved in measuring poverty, it is undeniable that poverty is still a problem, and a constant hindrance to our economic growth. The fact remains that our political, social and economic problems all arise out of, and contribute to, one common factor: Poverty. In addition, what the Oxford study highlighted was a lack of inclusiveness in our economic growth because of which marginalized groups and minorities in Nepal continue to suffer under poverty.
There are certain factors that have significant impact on whether we are poor or vulnerable to becoming poor. Variances in poverty level depend on rural-urban divide, ecological zones, ethnic groups, castes, literacy level, and gender. For example: According to the findings of the Nepal Living Standard Survey (NLSS), a rural household is more likely to be under poverty than an urban household. NLSS 2004 showed that 95 percent of the poor lived in rural areas.
Looking at the raw numbers, it seems that poverty is declining in Nepal. If the past trends hold true, it is safe to say that we are less poor today, and less vulnerable compared to our situation a decade or two ago. For example, in 1996, people in the mountains were more likely to live under poverty than those in the Terai or the hills. In 2004, those in the hills were more likely to be poor than those in the mountains.
However, an improvement in poverty in one scenario does not necessarily indicate improvement in all other fronts. Incidence of poverty reduction in the mountains today could be the result of declining mountain population due to migration downwards to the hills. Many people from the mountains and hills migrated because of Maoist insurgency, lack of economic opportunities, and changing environment and climate. Migration is also the main reason for drastic decline in poverty incidence in the mid-western and far-western regions since 1996.
Among the factors that have been observed to reduce poverty in households, education is the most important. Around 42 percent of illiterate households were poor in 2004. But, if at least one member of the household had more than 11 years of schooling, there was only 1.6 percent chance that the household would still be poor. The good news for us in this regard is that youth literacy rate is increasing today. As our youths become more literate, we can expect that to have an impact in lowering our poverty rates.
However, despite becoming more literate and educated, our youths are struggling to find jobs at home. As a result, they find themselves unemployed and disillusioned. Our inability to create jobs for them has a tendency to undo the progress that we have made by educating them. Our inability to harness the youth education and energy severely hinders our fight against poverty. If Nepal is to follow an inclusive growth approach, inclusion of our youths is vital to that approach.
There is a general consensus among Nepali experts that inclusive growth brings forth sustained and equitable development, social inclusion, empowerment of women, and security in the country. However, this consensus has not been translated into results. Experts have raised their concerns on issues such as integration of trade policy into overall development goals and strategies; export-led growth strategy with a human face; promotion of employment-intensive economic activities; making aid more inclusive and productive; and effective leadership. Until these desired results can be obtained, critics believe that Nepal will not see a proper inclusive growth.
The critics are right to some extent. A 2008 research by Magnus Hatlebakk, prepared for the Norwegian Embassy in Nepal, showed that Tamang and Rai people of eastern hills have high poverty rates. The highest poverty rates are found among the minorities like Magars, Dalits, and Tharus. NLSS I and II show high poverty among the minorities, and low among the upper caste Brahmins and Chhetris. 46 percent of Dalits, 41 percent of Muslims, and 43 percent of Janajatis were poor in 2004. According to a 2005 UNDP report, poverty rates for Dalits were 15 percent higher than the national poverty rate.
Therefore, there clearly exists a strong link between social exclusion—as defined by the caste hierarchy—and economic poverty. In recent years, remittance income has reduced the poverty incidence on female headed households. So, gender dimension in poverty could be reducing. However, despite some improvements in recent years, we have many more miles to go in achieving inclusive growth.
Labels: inclusive growth, poverty
Thursday, September 15, 2011
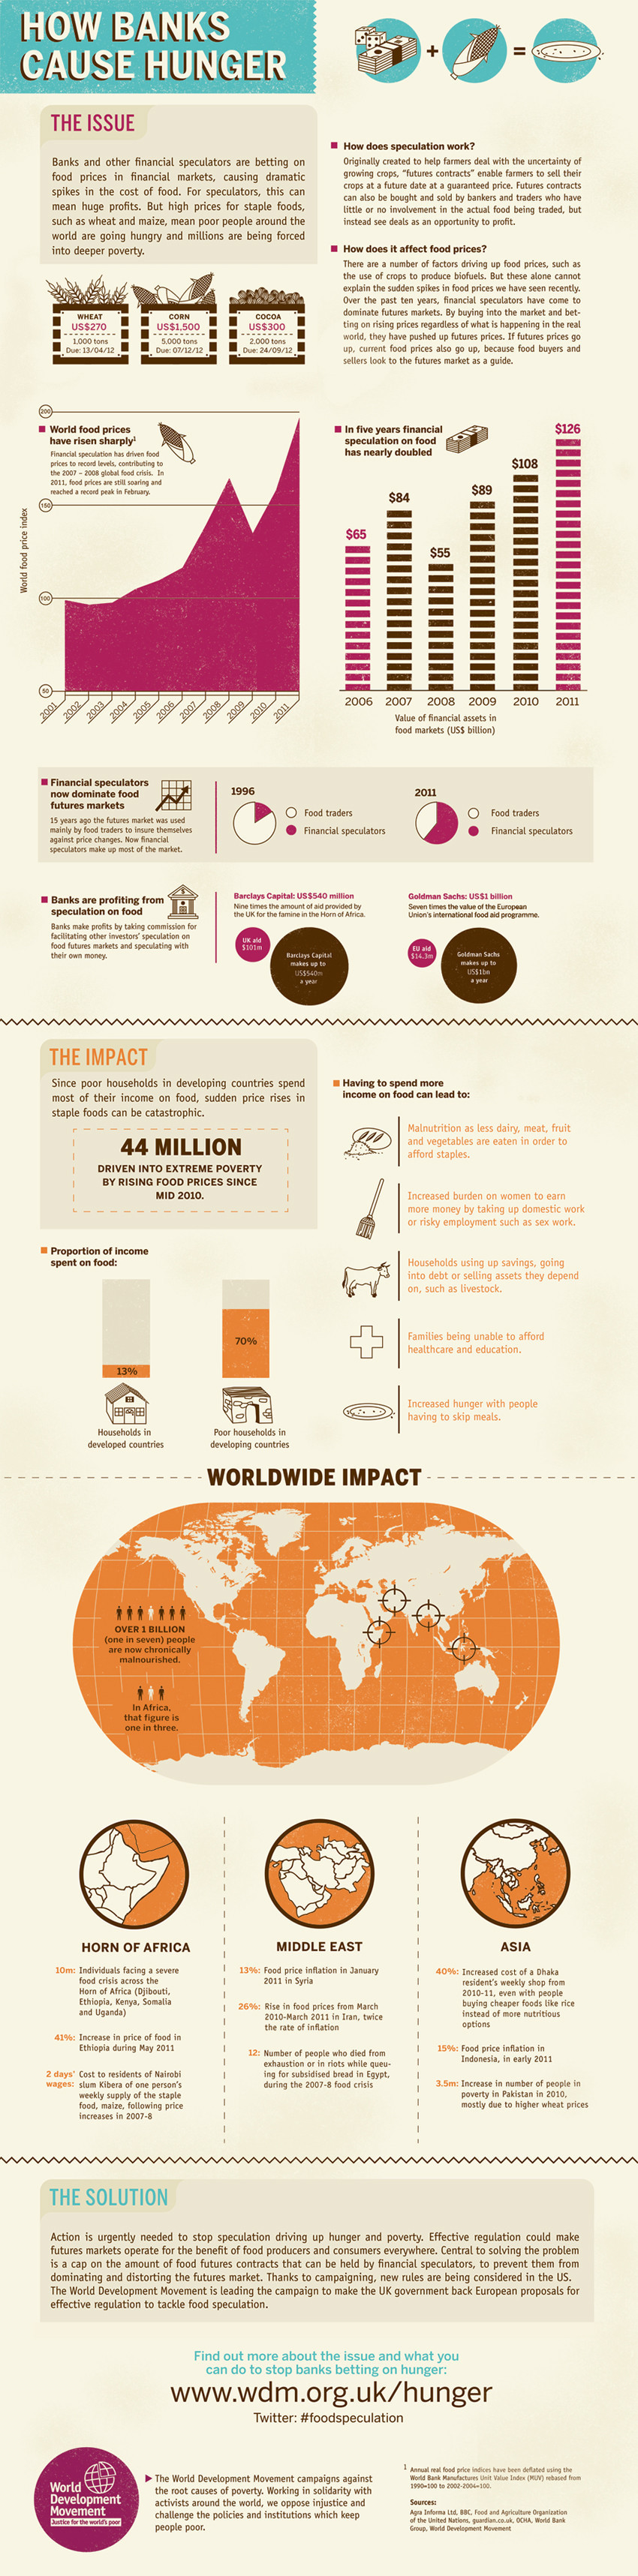
How Banks Cause Hunger
Wednesday, September 14, 2011
Published Paper: Monetary Neutrality in the Nepalese Economy
.
I had written a paper with a friend, Andrew Mueller, during our MA in University of Cincinnati for a course in Japanese Economy. The paper looked at whether Japan followed proper monetary policies or not during the period from 1980 to 2008 by observing whether "monetary neutrality" held true in the Japanese economy or not during that period.
After coming back to Nepal, I wanted to do the same thing, and wrote a paper to observe monetary neutrality in Nepal during the period 1975-2008. Both the studies used the same methodology--the VAR estimate.
The direct Nepal Rastra Bank's link is now available. Click here if you are interested.
Labels: central bank of nepal, monetary economics, monetary neutrality, NRB
Sunday, September 11, 2011
Links for Septemer 11, 2011
.
Record 95,000 trekkers visit Annapurna area last fiscal year
*85,000 tourists had visited the area in fiscal year 2009/10
*95,314 tourists visited the area in fiscal year 2010/11
*Total arrivals from South Asian region has declined by 25 percent and overall growth of other region stands at 9.4 percent
Bank of Kathmandu // 50.04
Standard Chartered Bank // 8.31
NIC Bank // 6.55
NABIL Bank // 5.68
Fewa Finance // 4.52
*85,000 tourists had visited the area in fiscal year 2009/10
*95,314 tourists visited the area in fiscal year 2010/11
*Total arrivals from South Asian region has declined by 25 percent and overall growth of other region stands at 9.4 percent
Number of tourists to the area had dropped by 40 percent in 2005. With the improvement in peace process, number of trekkers in this region has gone up. When the impact of Maoist insurgency was minimal, the number of trekkers had reached up to 76,407 in 2000. The number had dropped to 36,224 in 2005.Repeat visitors to Nepal down 81pc
...tourists making repeat visits to Nepal were down 81 percent in 2010...Among the 602,867 visitors to the country that year, 34,948 were repeat travellers and 428,485 were first-time visitors. In 2009, there were 191,693 repeat visitors among the 318,263 arrivals.
Among the 120,898 travellers from India, 75,057 were here for the first time while 3,541 were repeat visitors. Repeat visitors numbered 7,941 among the 45,531 Sri Lankan visitors to Nepal.Number of large tax payers doubles in 5 yrs, revenue triples
...number of large tax payers has almost doubled to 514 and their contribution to the national coffer tripled to around Rs 40 billion over the five years, thanks to better functioning of trading sector...number of large tax payers was 414 during the fiscal year 2009/10 with the revenue collection amounting Rs 32.87 billion...number of large taxpayers was 280 in 2006/07 when they paid revenue to the tune of Rs 12.41 billion
Revenue contributed by these tax payers touched Rs 39.95 billion with their number reaching 514 during the fiscal year 2010/11. The government collected Rs 22.55 billion as income tax, Rs 14.27 as VAT, Rs 2.76 billion as interest tax and Rs 224.25 million as rent tax from large tax payers during the year.
According to Large Taxpayers´ Office (LTO), the number of large taxpayers was 327, 366 and 414 in the year 2007/08, 2008/09 and 2009/10 respectively. Total revenue collection from the large taxpayers was Rs 17.2 billion, Rs 24.42 billion and Rs 32.87 billion in 2007/08, 2008/09 and 2009/10 respectively.
Average yearly contribution of a large tax payer to national exchequer is Rs 77.72 million during the fiscal year 2010/11, well up compared to Rs 44.32 million during the fiscal year 2007/08. Contribution of total 36 PEs to the government revenue as dividend was Rs 4.8 billion during the fiscal year 2009/10. According to the latest government data, 22 PEs reported profit whereas 14 PEs suffered loss with consolidated net profit touching Rs 10.55 billion during the year 2009/10.Maximum subsidy for optical fibre network set at Rs 3.27 billion
The project which will lay 4,000 km of fibre cable is estimated to cost around Rs 5 billion. Originally, the project planned in 2009 was estimated to cost Rs 8.40 billion for building a fibre network of 6,291 km by utilising the resources of the Rural Telecommunications Development Fund (RTDF). The new plan has avoided duplication of the networks which have already been set up by the telecom operators Nepal Telecom, Ncell and United Telecom.
...the company winning the bid for the western part would be provided a subsidy amounting to 90 percent of the project cost and that the subsidy for the eastern part would be 60 percent...the company will be able to use up to 75 percent of the total built fibre network for its own purpose; however, 25 percent of the network must be shared with other companies for expanding their services as per the criteria set.BFIs drag market 9.41 pts down
...the capital market last week plunged by 9.41 points to close at 329.63 points on Thursday...Only the group representing manufacturing sector registered a surge of 25.69 points. Groups representing commercial banks, hotels, hydropower companies and trading companies witnessed decline by 16.26, 0.94, 7.64 and 0.43 points, respectively. Likewise, insurance companies, finance companies and development banks saw a decline of 1.26, 2.71 and 2.15 points, respectively.Top five companies in terms of turnover (in Rs million)
Bank of Kathmandu // 50.04
Standard Chartered Bank // 8.31
NIC Bank // 6.55
NABIL Bank // 5.68
Fewa Finance // 4.52
Wednesday, September 7, 2011
Links for September 7
.
Vegetable prices drop in Kathmandu
Thanks to rise in production and end of festivals, price of most of the vegetables has gone downMaoist affiliated union causes popular Fire and Ice pizza restaurant to shut down
...the management was forced to close down the restaurant after the Maoist affiliated All Nepal Hotel Workers´ Association started a dispute over appointment of a new restaurant manager...members of the association along with its president manhandled some employees and misbehaved with the managementNRB caps Class B‚ C chief executives' salary
The central bank has directed the financial institutions — except class A commercial banks — to determine the remuneration for their CEOs based on the institution’s financial indicators...The central bank has asked the financial institutions to fix the salary of CEO based on the financial institutions’ business size, size of lending and deposits, size of operating profit, return on capital among others in the last three years.Trade deficit up to Rs 330.34 billion
The total exports is still less than six times (Rs 64.56 billion from total merchandise) the import of Rs 394.90 billion
...the share of India in Nepal’s total trade increased to 66.4 per cent in 2010-11 compared to 59.1 per cent a fiscal year ago
...overall Balance of Payment (BoP) that had remained in deficit till the ten months ended with a ‘surprise’ Rs 2.93 billion surplus against a deficit of Rs 3.63 billion in a fiscal year...current account deficit shrank to Rs 11.91 billion from a deficit of Rs 28.14 billion a year ago...net transfer account registered a growth of 8.9 per cent to Rs 307.86 billion compared to that of a year ago...pension receipts rose by 12.2 per cent to Rs 28.99 billion...workers’ remittances increased by 9.4 per cent to Rs 253.55 billion...FDI of Rs 6.44 billion was recorded compared to the level of Rs 2.85 billion a fiscal year ago...capital transfer increased by 26.5 per cent to Rs 15.91 billion compared to the level of Rs 12.58 billion a fiscal ago...gross foreign exchange reserves increased by a mere 1.2 per cent to Rs 272.10 billion in mid-July from the level of Rs 268.91 billion as at mid-July 2010...Of total reserve, NRB’s reserves augmented by 3.8 per cent to Rs 213.09 billion in mid-July 2011 from a level of Rs 205.37 billion as at mid-July 2010...gross foreign exchange reserves in Us dollar terms increased by 6.2 per cent to $3.84 billion in mid-July...Based on the trend of import during the review year, the current level of reserves is sufficient for financing merchandise imports of 8.4 months and merchandise and service imports of 7.3 monthsGinger farming all the rage among Kailali farmers
As much as 3,000 metric tons of ginger is produced from 500 hectares of land in the VDCs...ginger worth around Rs 100 million was supplied to India from hilly districts in the Far-Western Development Region last yearRukum farmers reap rich rewards of asparagus farming
...each farmer has...earned Rs 150,000 to Rs 300,000 from the commercial asparagus farming every yearAn interview with Surya Nepal's corporate vice president about whether or not their garment factory will repoen
Labels: exports, inflation, Kailali, labor unions, nepal rastra bank, Rukum, surya nepal
Monday, September 5, 2011
Links for September 5, 2011
.
Use of internet bandwidth increasing
*Consumers of data and internet services have reached to 3,111,858 with overall 10.89 per cent internet penetration rate by mid-July
*Nepal Telecom has a total of 1,133,876 data and internet subscribers
*Ncell has 1,874,078
*UTL has 51,377 internet subscribers
*ISPs have 52,527
*There are 42 Internet Service Providers (ISPs) in Nepal currently
Banks' shareholders return decreases
Governor calls for investment in agriculture‚ service sectors
Banks' interest income rising
Garments demand in Europe up
PM to set up Economic Cell
Four Dharan drug makers close factories...unions to blame?
Nepal Telecom slashes data tariff by 33 percent
Two-wheelers registration slumps
Industries’ closure hits women the most
Airlines raise frequency for peak tourist season
Use of internet bandwidth increasing
*Consumers of data and internet services have reached to 3,111,858 with overall 10.89 per cent internet penetration rate by mid-July
*Nepal Telecom has a total of 1,133,876 data and internet subscribers
*Ncell has 1,874,078
*UTL has 51,377 internet subscribers
*ISPs have 52,527
*There are 42 Internet Service Providers (ISPs) in Nepal currently
Banks' shareholders return decreases
In the last quarter of the fiscal year, the commercial banks’ return on equity recorded decline from that of third quarter when the average return on equity of the commercial banks stood at 15.56 per cent. Generally, the return on equity between 15 per cent and 20 per cent are considered desirable.
Among the 21 banks that have published Return on Equity in their financials, 12 commercial banks’ return on equity is above the average while nine commercial banks’ return on equity is less than the industrial average of 14.4 per cent.
Governor calls for investment in agriculture‚ service sectors
Banks' interest income rising
The higher lending interest rate due to tight liquidity situation pushed the interest income of the commercial banks by Rs 10 billion in the last fiscal year compared to a fiscal year ago. The total interest income of the commercial banks stood at Rs 37.8 billion by the end of fiscal year 2010-11, while the commercial banks had recorded Rs 27.8 billion a fiscal year ago, according to the unaudited financial report of fourth quarter released by the commercial banks.
In the last fiscal year (2010-11), the average net interest income of the commercial banks stood at Rs 1.21 billion while a fiscal year ago, the average net interest income of the whole banking sector was at Rs 896 million. Even discounting the four new commercial banks that were not in existence a fiscal year before, the average interest income of the old 27 commercial banks amount to Rs 1.38 billion in last fiscal year. In the preceding fiscal year these 27 banks had recorded Rs 1.03 billion as the average net interest income.
The old commercial banks’ interest income — that is income from interest on lending — rose to Rs 42 billion which was almost half at Rs 27 billion a fiscal year ago. The interest expense — that is interest paid for the depositors — also surged from Rs 57.5 billion to Rs 80.5 billion in fiscal year 2010-11.
The interest rate offered by the banks for deposit ranges from mere two per cent to 12 per cent, according to Nepal Rastra Bank (NRB) data
Garments demand in Europe up
...export of Nepali ready made garments has increased by 11.5 per cent compared to same period last year in the first eleven month of the last fiscal year...
PM to set up Economic Cell
Four Dharan drug makers close factories...unions to blame?
Nepal Telecom slashes data tariff by 33 percent
NT data uses will now have to pay just 10 paisa for 100 KB of data. Earlier, the state-owned telecom operator was charging 15 paisa per 100 KB. The tariff is applicable for subscribers using via from GPRS, PDSN, EVDO and 3G technologies.
NT has also slashed inter-zone voice tariff from VSAT, PSTN and fixed CDMA to GSM and CDMA to Rs 1 per minute. It was charging Rs 2 per minute for the service.
The state-owned telecom operator has also slashed subscription charge for CDMA Skyphone to Rs 600 with the talk value of Rs 500. Previously, it was charging Rs 1,135 as service charge for CDM Skyphone.
Two-wheelers registration slumps
...4,761 units of two-wheelers were registered in the first month of the current fiscal year in Bagmati zone...In the fiscal year 2010/11, about 53,960 units of bikes were registered in the Bagmati zone...Currently, Nepali customers pay 80 percent tax on two-wheelers and 238 percent tax on four-wheelers
Industries’ closure hits women the most
...around 20,000 workers lost their jobs in the past seven years in the Morang-Sunsari corridor. Of them, around 60 percent were women. The seven years saw more than two dozen industries of readymade garment products, ghee, jutes and zinc plate, shut down.
...the Surya Nepal’s garment division was employing 550 women...JD Apparels that was shut down one-and-a-half years ago had 1,300 women working...700 women lost their jobs when Easy Wear was closed
Airlines raise frequency for peak tourist season
Bhutan’s national carrier Druk Air, which currently operates daily flights between Kathmandu and Paro, has applied for six additional flights weekly under the temporary operating permit (TOP) from Sept 29
Air China and China Southern Airlines...have added three and four flights per week respectively, increasing their frequency to seven per week...Fly Dubai has been granted seven additional flights under the TOP for a total of 14 flights per week...Qatar Airways has upped its flight frequency to 28 flights per week from 21 which will be operational from Oct 1...Hong Kong-based Dragonair has increased its Kathmandu-Hong Kong flights to seven per week from thrice a week...Gulf Air is planning to add two flights per week due to strong demand from the European market
Bahrain Air and Arke Fly have announced resumption of their operations to Nepal. Bahrain Air resumed its flights from Sept 2 while Netherlands-based Arke Fly is scheduled to start service from Sept 23. Arke Fly will be operating a weekly flight while Bahrain Air operates a daily flight....Low-cost Indian carrier IndiGo will be the 28th international airline in Nepal’s skies when it starts its daily service from the second week of October
Labels: airlines, banks, garment, internet, labor unions, nepal telecom, nepal tourism year
Friday, September 2, 2011
Links for September 2, 2011
.
1. Nepal's 238 percent tax on imported vehicles is a waste of taxpayers' money
2. Nepalese Commercial banks show low trust on other Financial Institutions
3. US Ambassador to Nepal says "It's the economy, stupid."
4. British Army announces Gurkha troop reduction
5. China promises to promote tourism in Nepal
6. Department of Customs suspects capital flight using fake bills
7. Food security situation remains stable in Nepal
8.Tourist arrivals via air up by over 26 percent in August...Some Numbers
*arrivals from South Asian region have gained robust growth of 38.7 percent
*India 50 percent
*Bangladesh 20.9 percent
*Sri Lanka 11.7 percent
*Pakistan 1 percent
*arrivals from other Asian regions have also registered growth by 57.2 percent
*China 157.6 percent
*Malaysia 95.2 percent
*Thailand 55.6 percent
*Singapore 51.6 percent
*Japan 9.5 percent
*Arrivals from South Korea declined by 10.7 percent
*arrivals from Europe registered overall positive growth of 0.9 percent
*Germany 51.5 percent
*Belgium 28.2 percent
*Denmark 16.2 percent
*Italy 9.3 percent
*Sweden 7.5 percent
*UK 3 percent
*Arrivals from France declined by 13.8 percent
*Arrivals from Netherlands declined by 11 percent
*Arrivals from Russia declined by 31.2 percent
*Arrivals from Spain declined by 10.3 percent
*arrivals from Australia registered growth of 19.7 percent
*arrivals from New Zealand registered growth of 7 percent
*arrivals from USA registered growth of 16.9 percent
*arrivals from Canada registered growth of 33 percent
*49,858 foreign tourists departed from TIA in August 2011.
*52,811 Nepali arrived while 64,326 departed from TIA in August 2011.
1. Nepal's 238 percent tax on imported vehicles is a waste of taxpayers' money
2. Nepalese Commercial banks show low trust on other Financial Institutions
3. US Ambassador to Nepal says "It's the economy, stupid."
4. British Army announces Gurkha troop reduction
5. China promises to promote tourism in Nepal
6. Department of Customs suspects capital flight using fake bills
...The department has unearthed fake abbreviated customs declaration forms...there could be two reasons behind producing fake abbreviated customs declaration forms: to produce legal documents to the imported goods through illegal points or to misuse foreign currency
The department has suspected capital flight by two Birgunj-based firms — Shyam Galla and JB traders and arrested them. It is estimated that some Rs 300 million has been misused by Shyam Galla and Rs 160 million by JB Traders
The issue had come into the light after police on August 29 nabbed five people with fake customs declaration forms. They were trying to get more than Rs 7.52 million transferred to India on the basis of the counterfeit documents.
7. Food security situation remains stable in Nepal
...attributed to a good harvest of winter crops (April-June) and employment opportunities generated by development aid...wheat and barley production increased by 12.2 per cent and 9.6 per cent respectively compared to last year
...but, 28 Village Development Committees (VDCs) in the south-western belt of the district as highly food insecure...because of...a 60 per cent reduction of wheat and spring paddy production due to a dry spell, which was cumulative to the 2010 reduction of 40-60 per cent in the main paddy production.
Parts of the Eastern Hill and Mountain districts are reported as moderately food insecure...Most of the Mid and the Far Western Hill and Mountain districts reported a food secure situation...a seasonal deterioration is reported in part of the Eastern Hill and Mountain districts where the winter crops of wheat and barley are cultivated in limited areas and do not play a vital role in food security...situation in upper Dolpa and some Village Development Committees in the northern and the southernbelt of Baitadi are likely to deteriorate to the highly food insecure phase during the next cycle as there will be no incoming harvest and employment opportunities as well as market supply will be affected by monsoon
According to the central bank, High food prices remain a concern. The year-on-year inflation, measured by the Consumer Price Index, increased by 8.8 per cent in mid-June 2011 whereas the indices of the cereal subgroup increased by 10.4 per cent.
8.Tourist arrivals via air up by over 26 percent in August...Some Numbers
*arrivals from South Asian region have gained robust growth of 38.7 percent
*India 50 percent
*Bangladesh 20.9 percent
*Sri Lanka 11.7 percent
*Pakistan 1 percent
*arrivals from other Asian regions have also registered growth by 57.2 percent
*China 157.6 percent
*Malaysia 95.2 percent
*Thailand 55.6 percent
*Singapore 51.6 percent
*Japan 9.5 percent
*Arrivals from South Korea declined by 10.7 percent
*arrivals from Europe registered overall positive growth of 0.9 percent
*Germany 51.5 percent
*Belgium 28.2 percent
*Denmark 16.2 percent
*Italy 9.3 percent
*Sweden 7.5 percent
*UK 3 percent
*Arrivals from France declined by 13.8 percent
*Arrivals from Netherlands declined by 11 percent
*Arrivals from Russia declined by 31.2 percent
*Arrivals from Spain declined by 10.3 percent
*arrivals from Australia registered growth of 19.7 percent
*arrivals from New Zealand registered growth of 7 percent
*arrivals from USA registered growth of 16.9 percent
*arrivals from Canada registered growth of 33 percent
*49,858 foreign tourists departed from TIA in August 2011.
*52,811 Nepali arrived while 64,326 departed from TIA in August 2011.
Labels: banks, capital flight, china, customs, financial institutions, food security, gurkhas, imports, tourism, vehicle tax
![]()
Subscribe to Comments [Atom]
